In this part 1 post, we’ll go over Setting Up the Data:
- Creating a Sink: How to get BigQuery job cost details into a table (Using Logs Explorer)
- Previewing Raw Jobs Cost Table: What the raw table will look like
- Creating a Final Model: How to extract the information needed to power a dashboard
In part 2, we’ll go over Creating the Report:
- How to create the Job Cost Monitoring Dashboard in Tableau
These will help you to:
- Monitor your month-to-date compute costs in BigQuery as you’re constantly using it
- See where the queries are coming from (whether it’s from different users querying your datasets, or if it’s a server querying it like Tableau or another tool)
Intro
This is a report you could use to help monitor your real-time usage of BigQuery. The first 1TB of processed data is free per month, but any after that is billed at $5 per 1TB.
There are standard cost reports you can pull from the Billing section in Google Cloud Platform instead without doing any extra configuration or work, but the data is very limited and minimal, and it won’t give you a ton of insights nor details (at the time of this writing).
With that, let’s dive in…
Step 1: Use Google Cloud Logs Explorer to Get Job Details
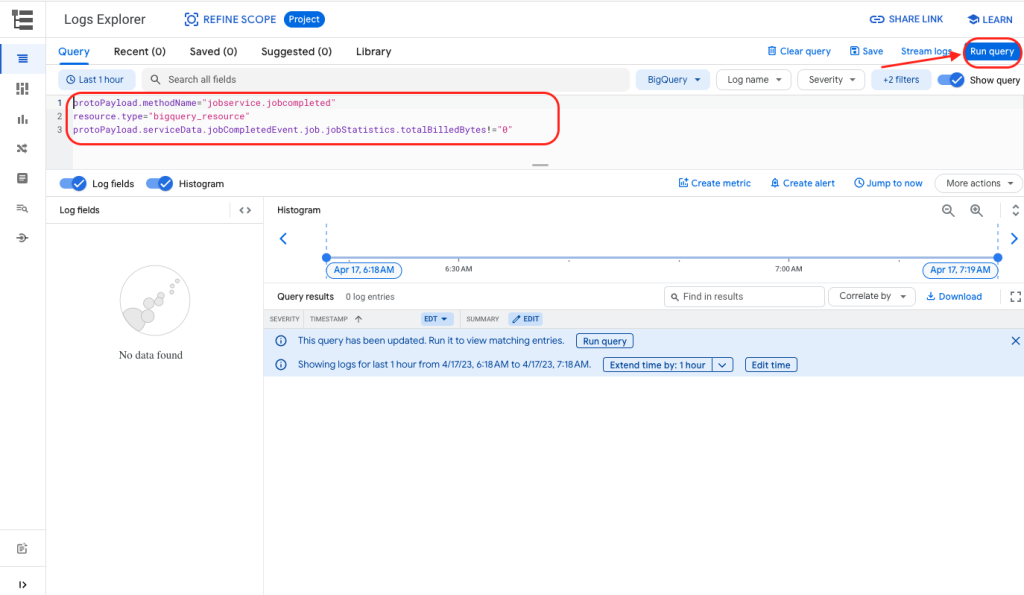
Go to Logs Explorer, and run the following query:
protoPayload.methodName="jobservice.jobcompleted"
resource.type="bigquery_resource"
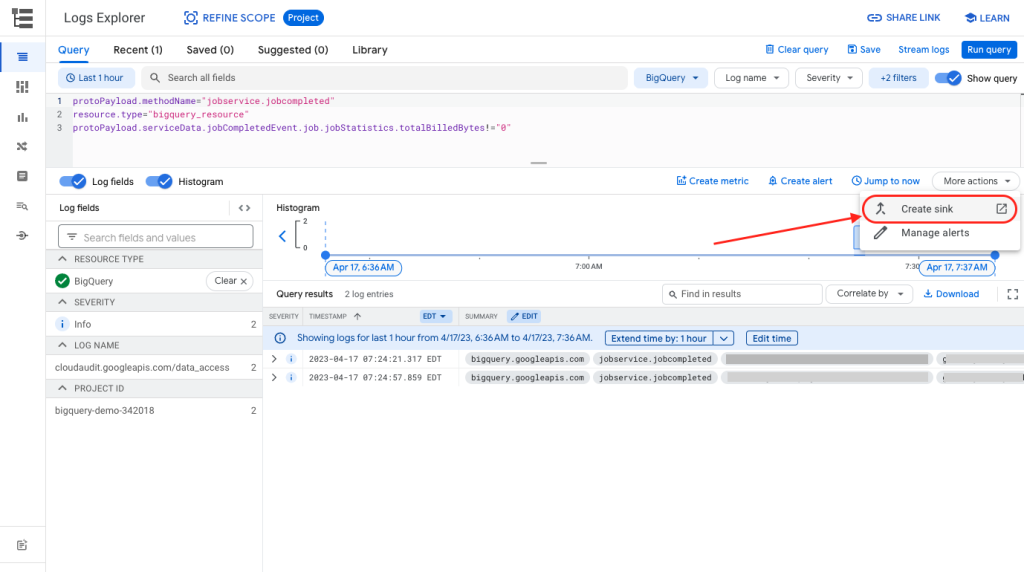
protoPayload.serviceData.jobCompletedEvent.job.jobStatistics.totalBilledBytes!="0"Inside Logs Explorer….
Click More Actions > Create Sink…
Enter a sink name…
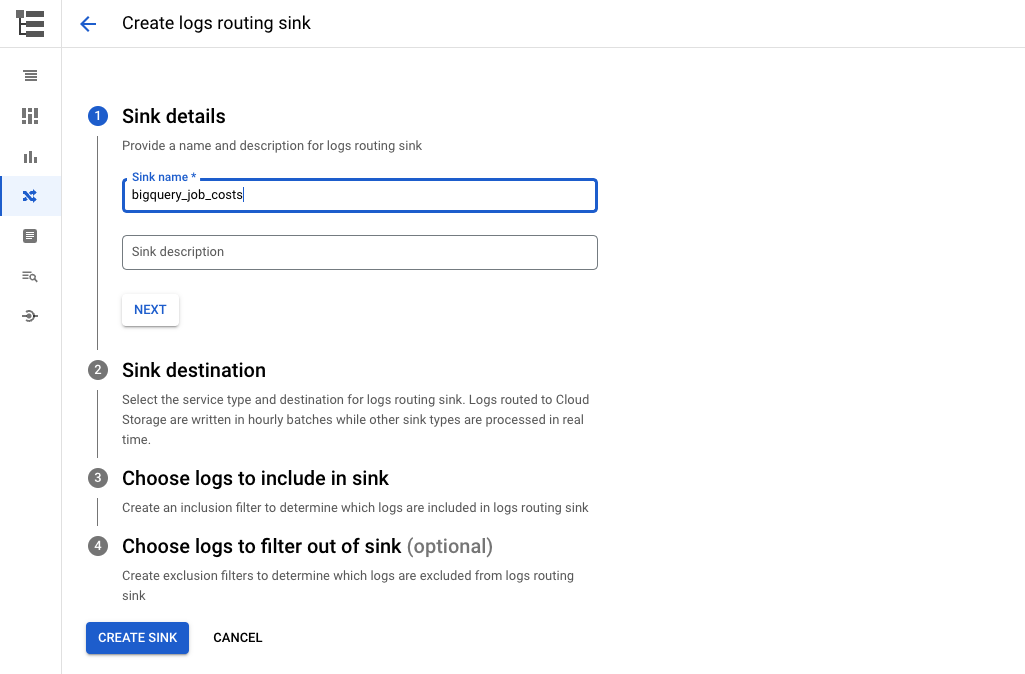
Enter sink destination…
For Sink Service, select “BigQuery dataset”.
This will send the data to one of your datasets in BigQuery. Then select an existing dataset you want to place it in, or create a new one.
In this case, I created a new dataset called “google_cloud_logs”.
Check “Use partitioned tables”.
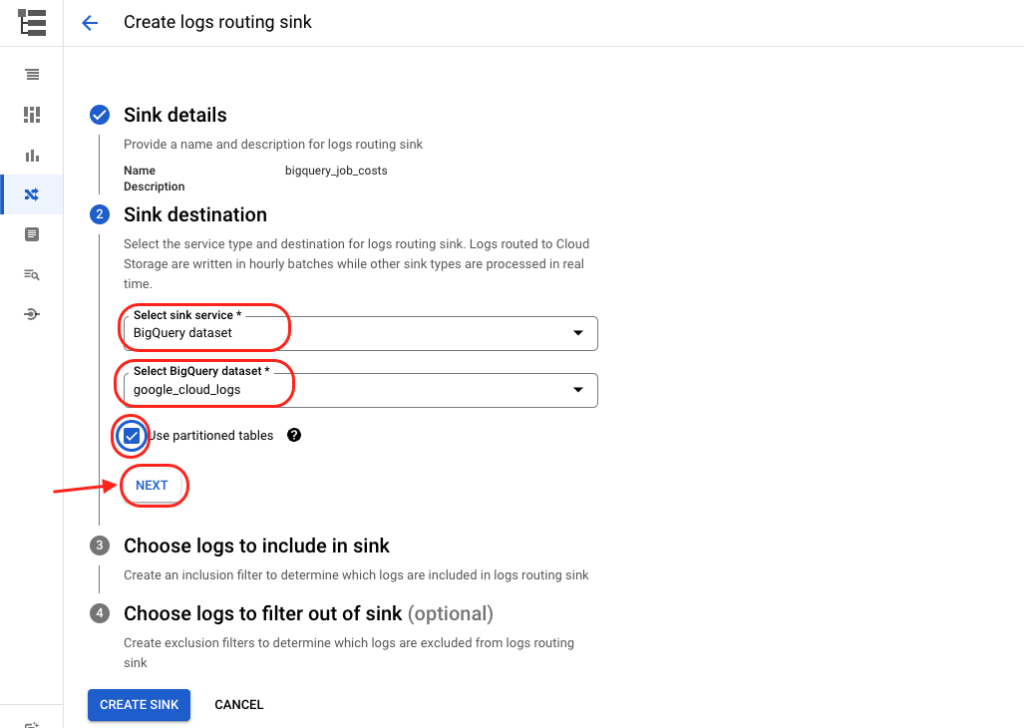
Choose logs to include in sink…
This part should already be auto-filled for you using the query you entered above.
If not, you can enter it here.
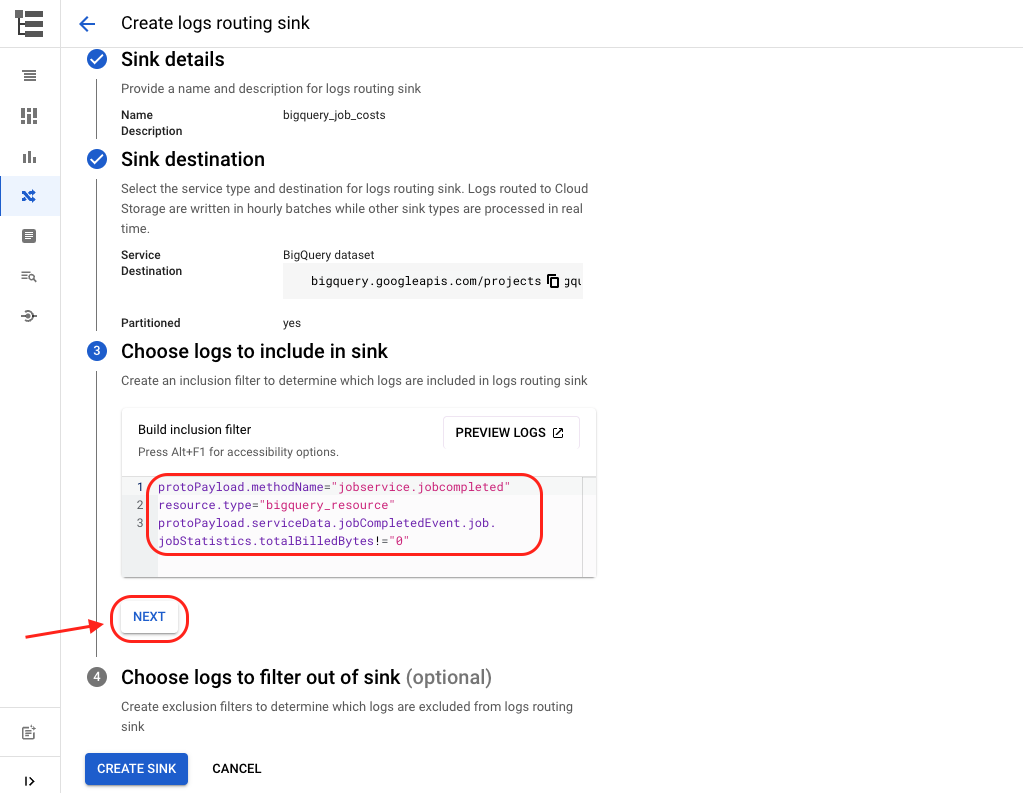
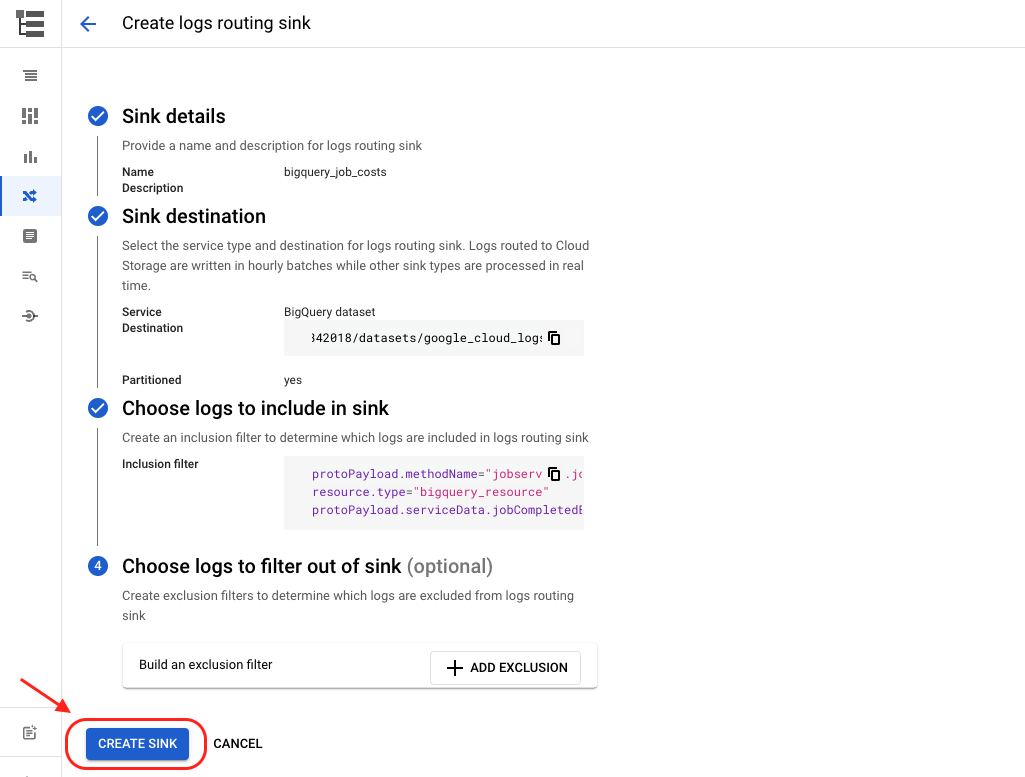
Finally, hit “Create Sink”.
Step 2: Preview Raw Logs Table
Let’s head on over to BigQuery now and run a sample query.
Run any query you want, so we can get some data flowing into the raw logs table.
Sample Query:
SELECT * FROM ANYTABLEYOUWANTThen query the table in your google_cloud_logs dataset.
Query to Preview Raw Logs Data:
SELECT * FROM `ENTER-YOUR-PROJECT-ID-HERE.google_cloud_logs.cloudaudit_googleapis_com_data_access` WHERE DATE(timestamp) = CURRENT_DATE()You should see at least one new row in the table.
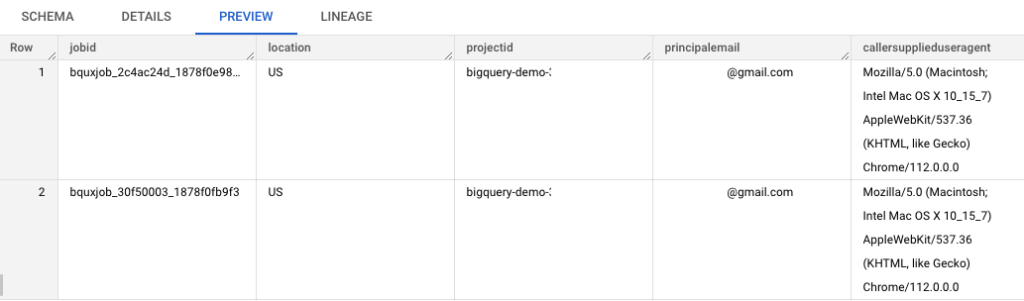
Output Preview of Raw Logs Data:
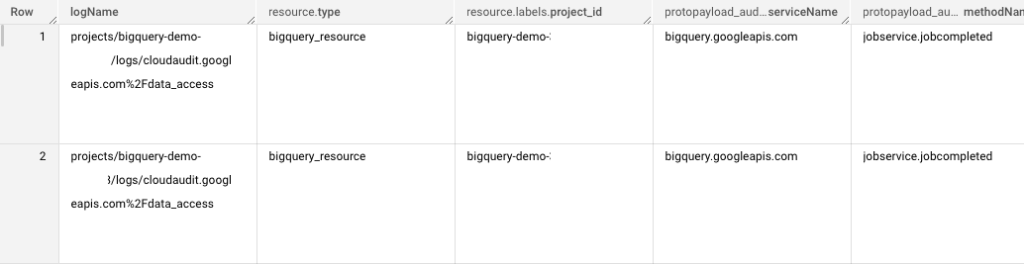
At this point, the schema (structure) of the table may not make sense to you.
That’s okay… we’re going to extract the information we want now from this table.
Step 3: Extract Job Cost Data from Your Newly Created Logs Table
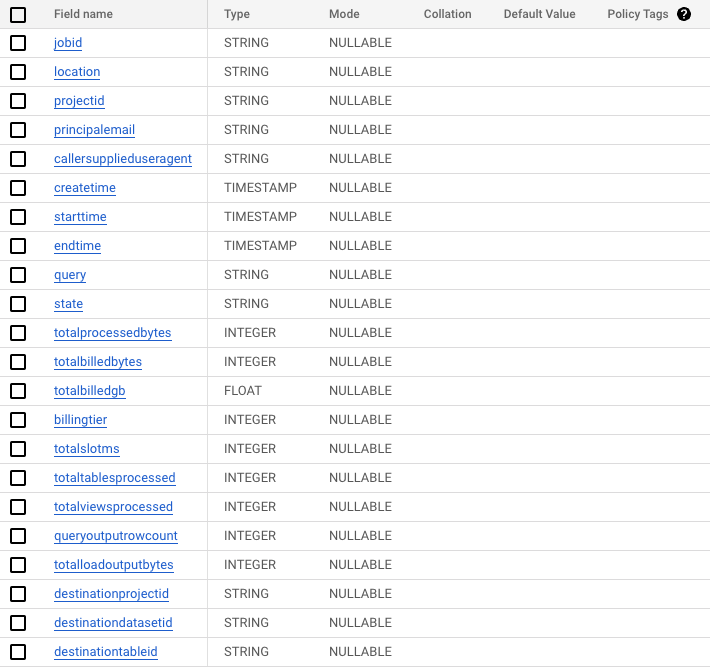
Here are the columns we want our final table to include…
You may or may not need all, but I included some more fields in case we want to analyze by them in the future.
Final table fields:
- job id
- job location
- job project id
- authentication email
- caller supplied user agent
- create time
- start time
- end time
- the query
- status
- bytes processed
- bytes billed
- gb billed
- billingTier
- totalSlotMs
- referenced tables count
- destination project id
- destination dataset id
- destination table id
And below is the query we want to run in order to extract those fields…
The “Extraction” Query for final table:
with source as (
  select
    *
  from
    `ENTER-YOUR-PROJECT-ID-HERE`.`google_cloud_logs`.`cloudaudit_googleapis_com_data_access`
),
selected as (
  select
    protopayload_auditlog.servicedata_v1_bigquery.jobcompletedevent.job.jobname.jobid,
    protopayload_auditlog.servicedata_v1_bigquery.jobcompletedevent.job.jobname.location,
    protopayload_auditlog.servicedata_v1_bigquery.jobcompletedevent.job.jobname.projectid,
    protopayload_auditlog.authenticationinfo.principalemail,
    protopayload_auditlog.requestmetadata.callersupplieduseragent,
    protopayload_auditlog.servicedata_v1_bigquery.jobcompletedevent.job.jobstatistics.createtime,
    protopayload_auditlog.servicedata_v1_bigquery.jobcompletedevent.job.jobstatistics.starttime,
    protopayload_auditlog.servicedata_v1_bigquery.jobcompletedevent.job.jobstatistics.endtime,
    protopayload_auditlog.servicedata_v1_bigquery.jobcompletedevent.job.jobconfiguration.query.query,
    protopayload_auditlog.servicedata_v1_bigquery.jobcompletedevent.job.jobstatus.state,
    protopayload_auditlog.servicedata_v1_bigquery.jobcompletedevent.job.jobstatistics.totalprocessedbytes,
    protopayload_auditlog.servicedata_v1_bigquery.jobcompletedevent.job.jobstatistics.totalbilledbytes,
    protopayload_auditlog.servicedata_v1_bigquery.jobcompletedevent.job.jobstatistics.totalbilledbytes / 1024 / 1024 / 1024 as totalbilledgb,
    protopayload_auditlog.servicedata_v1_bigquery.jobcompletedevent.job.jobstatistics.billingtier,
    protopayload_auditlog.servicedata_v1_bigquery.jobcompletedevent.job.jobstatistics.totalslotms,
    protopayload_auditlog.servicedata_v1_bigquery.jobcompletedevent.job.jobstatistics.totaltablesprocessed,
    protopayload_auditlog.servicedata_v1_bigquery.jobcompletedevent.job.jobstatistics.totalviewsprocessed,
    protopayload_auditlog.servicedata_v1_bigquery.jobcompletedevent.job.jobstatistics.queryoutputrowcount,
    protopayload_auditlog.servicedata_v1_bigquery.jobcompletedevent.job.jobstatistics.totalloadoutputbytes,
    protopayload_auditlog.servicedata_v1_bigquery.jobcompletedevent.job.jobconfiguration.query.destinationtable.projectid as destinationprojectid,
    protopayload_auditlog.servicedata_v1_bigquery.jobcompletedevent.job.jobconfiguration.query.destinationtable.datasetid as destinationdatasetid,
    protopayload_auditlog.servicedata_v1_bigquery.jobcompletedevent.job.jobconfiguration.query.destinationtable.tableid as destinationtableid
  from
    source
)
select
  *
from
  selected
Afterwards, you will now have a table storing each BigQuery job details including its billable cost information.
Preview of Data from “Extraction” Query:
Schema of Temporary Table from “Extraction” Query:
Since right now, that query has only run once, you will need to have it continually running on a schedule if you would like to have your data updated in real-time.
*Note: The Logs Explorer -> Sink -> BigQuery Table connection is in near real-time. Anytime you run a query, that query’s metadata will pass through and end up in your “raw table”, a.k.a your dataset: `google_cloud_logs` and table: `cloudaudit_googleapis_com_data_access`.
The “extraction” query above will need to be scheduled on a recurring basis, in order to have your final table (the one that’s powering your dashboard) be in real-time also.
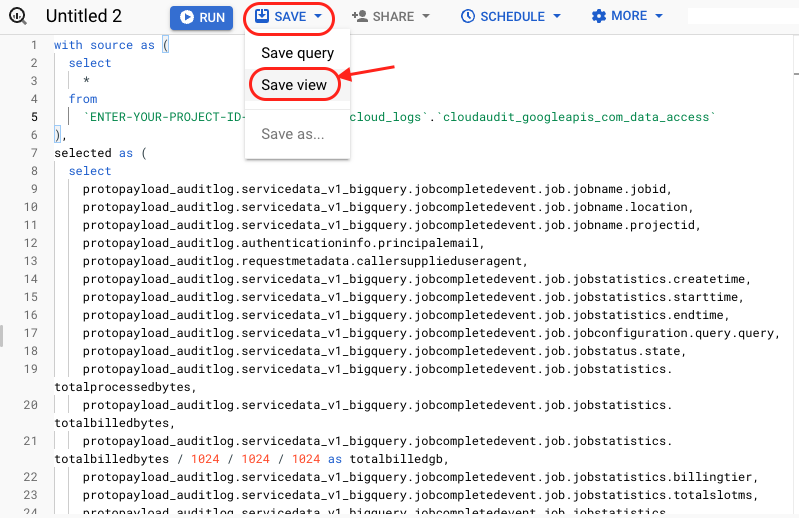
To make things simple, just save your “extraction” query as a view. That way, anytime the query is run, it will always pull the most updated data.
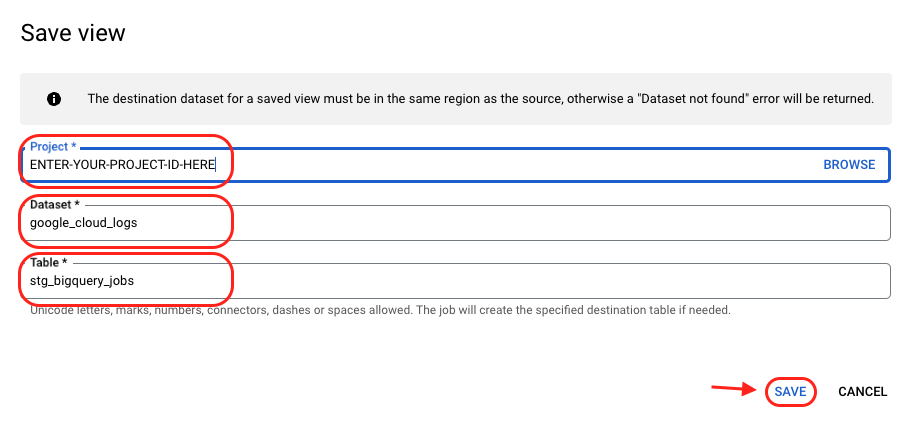
Lastly, save your “Extraction” query as a view
- Enter your project ID
- Enter the dataset where you stored your cloud logs data (or any other dataset you’d like)
- Enter name of the view you’d like to call it (i.e. stg_bigquery_jobs*)
*”stg” is a convention and is short-hand for “staging”