The Announcement
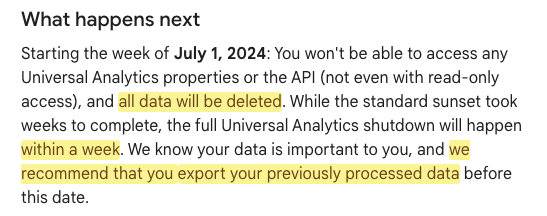
Google has announced that all customers will lose access to Universal Analytics properties and API starting on July 1, 2024.
Here is what Google says will happen:
What you should know:
- It will start the week of July 1, 2024
- You won’t be able to access anything
- All data will be deleted
- Will happen within a week
- Recommended to export previously processed data
So with that, I have spent the last couple of months reverse-engineering the Universal Analytics platform reports and found a way to export the exact data schemas needed to replicate those reports.
Now… I’m offering them to you – for free!
The Best Way to Export Universal Analytics Data (w/ Free Templates)
How to Export Universal Analytics Data the Easy Way using the Google Analytics Add-On Tool
This export process uses the Google Sheets Add-on Tool for Google Analytics to export data.
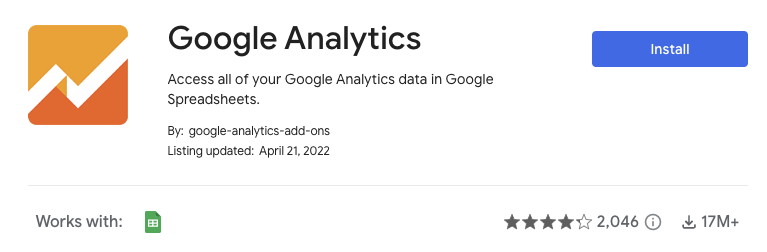
You can install the add-on here: https://workspace.google.com/marketplace/app/google_analytics/477988381226
Once installed, you’ll be able to see an option within your Google Sheets menu here:
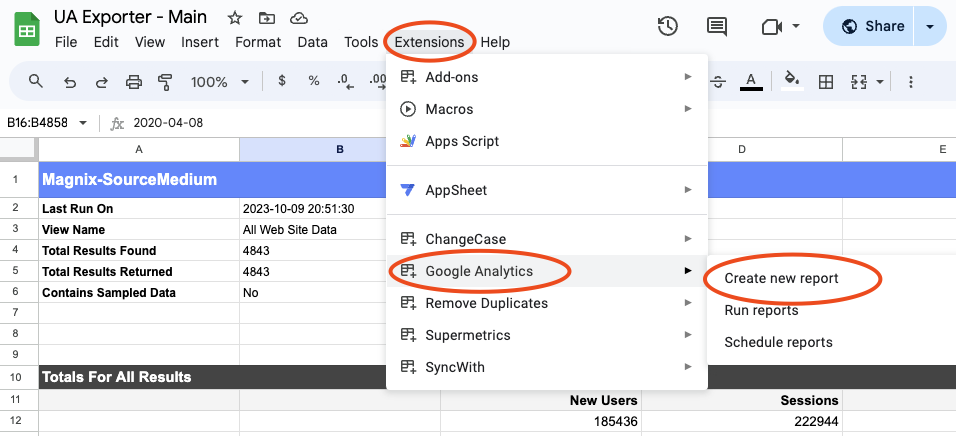
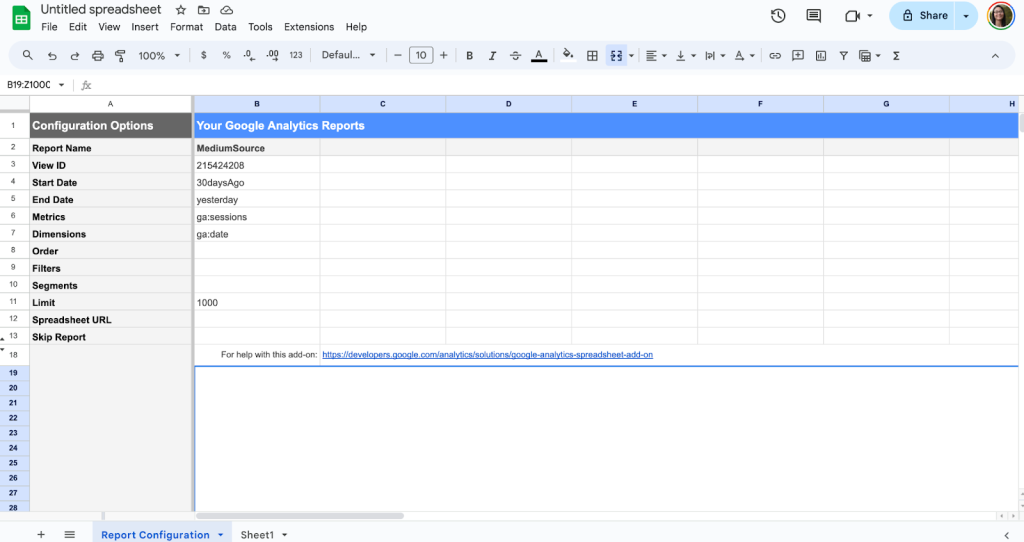
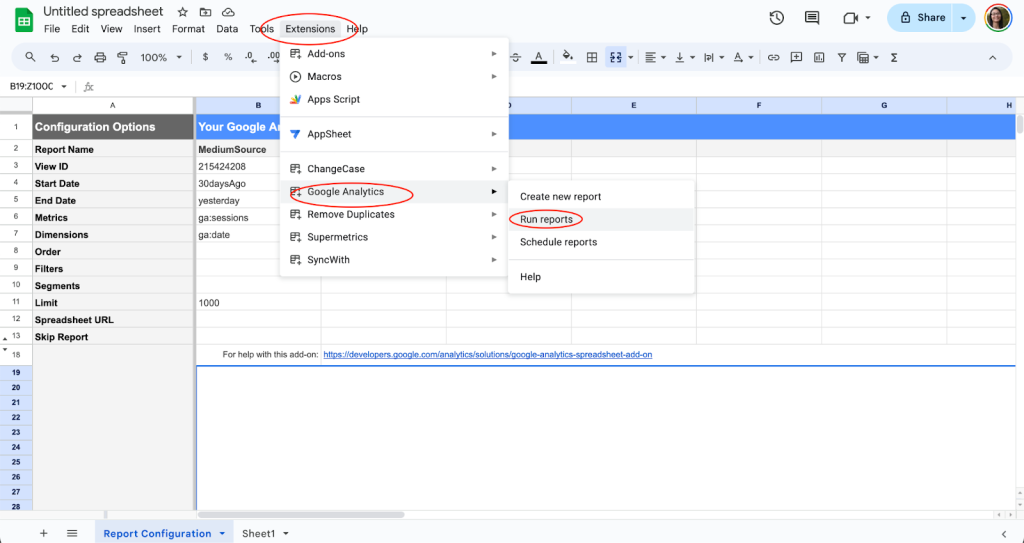
After opening a new Google Sheets doc, clicking on “Extensions”, hovering over “Google Analytics”, you’ll be able to click on “Create a new report”, which will open up a report configuration menu on the right-hand side of your sheet.
This is where you’ll add in your Universal Analytics property details and the schema (which consists of the dimensions and metrics you’ll add into the report.)
Export a Sample Report:
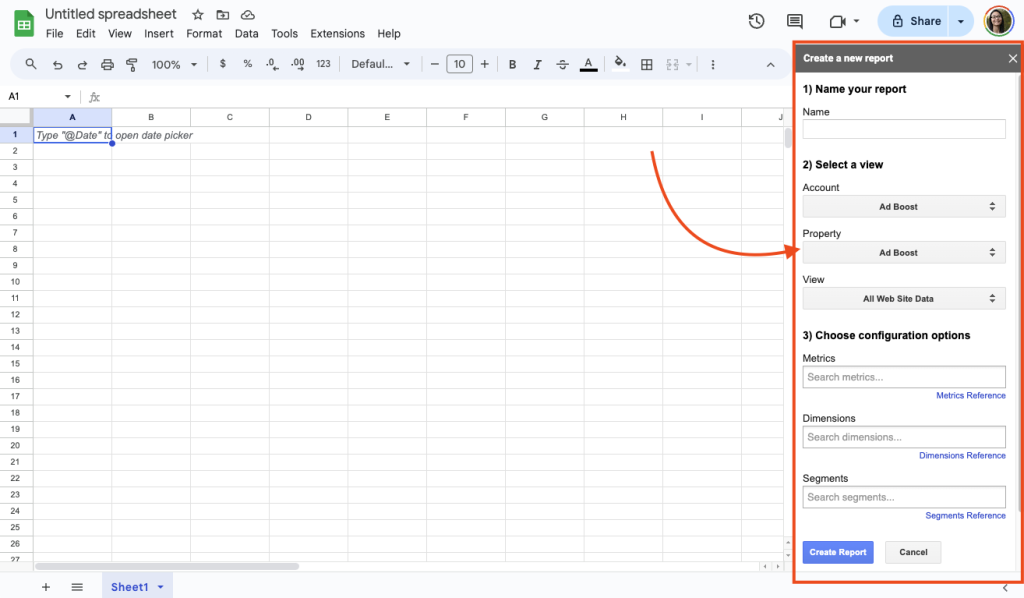
Try exporting one sample report, so you can see how it works.
- Add a name (can be titled anything in any format) – I’ll add in “MediumSource”
- Select a view – The account, property, and view refers to the Universal Analytics property you want to export data from
- Choose configuration options – This is where we’ll add in our schema:
- Metrics – Add in “sessions” for now
- Dimensions – Add in “date” for now
- Click Create Report
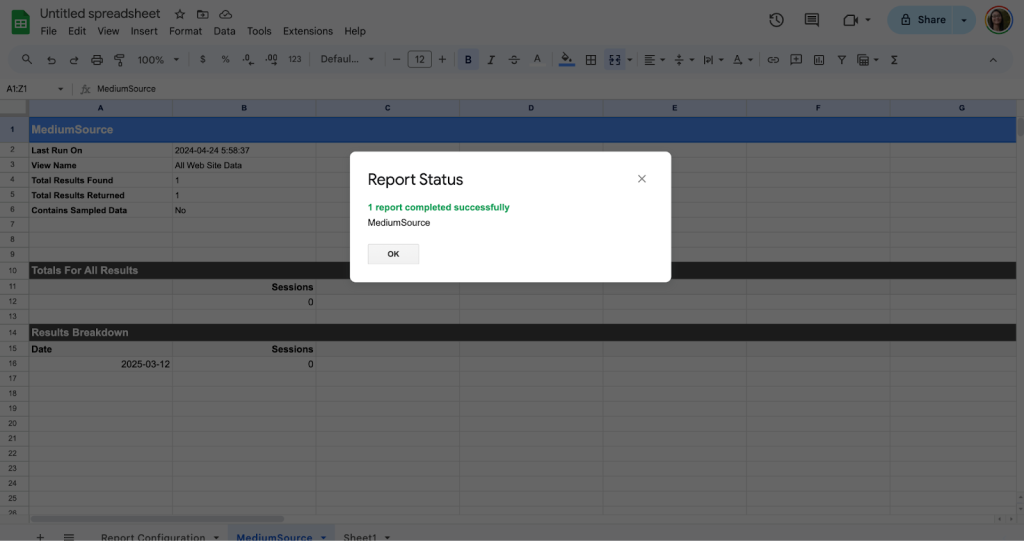
A new sheet tab will open up with your report details populated in a single column:
Some things to note:
- Each new report you create will be added on to the “Report Configuration” tab as a new column
- Start Date and End Date formats can be:
- “30daysAgo”
- “yesterday”
- “YYYY-MM-DD” format – aka. “2021-01-01”
- Metrics & Dimensions:
- Always prefixed with a “ga:”
- Limit: The max number of rows you want to pull in – By default, it will say “1000”, but I recommend to just delete this so you can get all the rows
- Skip Report: If set to “True”, it will not run this report when you hit “Run reports”
To Run Your Reports;
Go to Extensions > Google Analytics > Run reports
A successful run will give you a screen that looks like this:
Free Export Schema Template for Universal Analytics Data Export
Now, you ask, where are the free templates? Well here they are…
Instead of trying to figure out what dimensions, metrics, and data you will need in the future, I’ve come up with the schemas you’ll need in order to replicate the Universal Analytics platform reports.
Here they are:
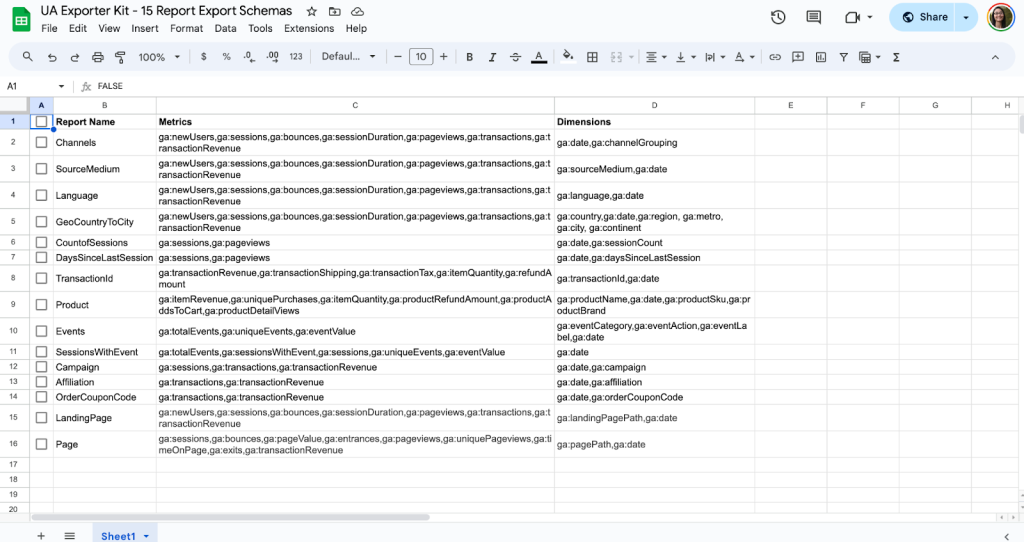
Make a copy of the schema template here: Google Analytics Export Schemas
This includes 15 different report schemas you can use to power a replicated Universal Analytics dashboard.
In case you would like the text version:
| Report Name | Metrics | Dimensions |
| Channels | ga:newUsers,ga:sessions,ga:bounces,ga:sessionDuration,ga:pageviews,ga:transactions,ga:transactionRevenue | ga:date,ga:channelGrouping |
| SourceMedium | ga:newUsers,ga:sessions,ga:bounces,ga:sessionDuration,ga:pageviews,ga:transactions,ga:transactionRevenue | ga:sourceMedium,ga:date |
| Language | ga:newUsers,ga:sessions,ga:bounces,ga:sessionDuration,ga:pageviews,ga:transactions,ga:transactionRevenue | ga:language,ga:date |
| GeoCountryToCity | ga:newUsers,ga:sessions,ga:bounces,ga:sessionDuration,ga:pageviews,ga:transactions,ga:transactionRevenue | ga:country,ga:date,ga:region, ga:metro, ga:city, ga:continent |
| CountofSessions | ga:sessions,ga:pageviews | ga:date,ga:sessionCount |
| DaysSinceLastSession | ga:sessions,ga:pageviews | ga:date,ga:daysSinceLastSession |
| TransactionId | ga:transactionRevenue,ga:transactionShipping,ga:transactionTax,ga:itemQuantity,ga:refundAmount | ga:transactionId,ga:date |
| Product | ga:itemRevenue,ga:uniquePurchases,ga:itemQuantity,ga:productRefundAmount,ga:productAddsToCart,ga:productDetailViews | ga:productName,ga:date,ga:productSku,ga:productBrand |
| Events | ga:totalEvents,ga:uniqueEvents,ga:eventValue | ga:eventCategory,ga:eventAction,ga:eventLabel,ga:date |
| SessionsWithEvent | ga:totalEvents,ga:sessionsWithEvent,ga:sessions,ga:uniqueEvents,ga:eventValue | ga:date |
| Campaign | ga:sessions,ga:transactions,ga:transactionRevenue | ga:date,ga:campaign |
| Affiliation | ga:transactions,ga:transactionRevenue | ga:date,ga:affiliation |
| OrderCouponCode | ga:transactions,ga:transactionRevenue | ga:date,ga:orderCouponCode |
| LandingPage | ga:newUsers,ga:sessions,ga:bounces,ga:sessionDuration,ga:pageviews,ga:transactions,ga:transactionRevenue | ga:landingPagePath,ga:date |
| Page | ga:sessions,ga:bounces,ga:pageValue,ga:entrances,ga:pageviews,ga:uniquePageviews,ga:timeOnPage,ga:exits,ga:transactionRevenue | ga:pagePath,ga:date |
What you’ll do is copy-paste a set of dimensions and metrics for the report type you want and then run that report with the date ranges of your UA property for the data you want exported.
Visualize Your UA Data with a Google Looker Studio Report Dashboard
Now, if you want to go a step further and ask: “Well okay, this is all nice and dandy, but how will I be able to access & visualize my data easily if they’re all stuck in different Google Sheets?”
Not to worry – I’ve got a Looker Studio (formerly Google Data Studio) dashboard report template for you:
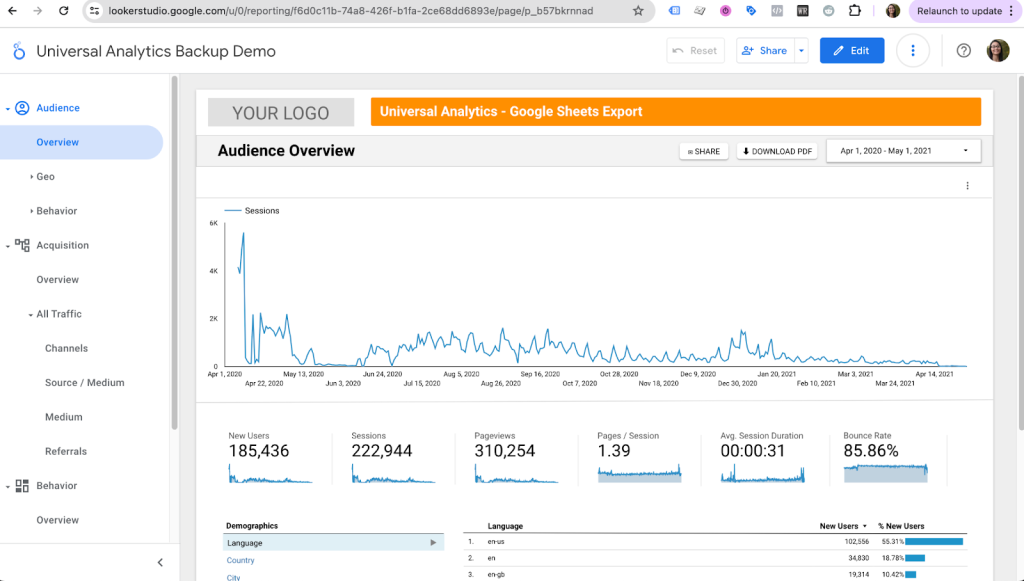
Open dashboard demo here: Google Looker Studio Dashboard Demo for Universal Analytics Data
> If you’d like to make a copy of the dashboard report, send an email to grace@vonndata.com to be added to the report for free.
The cool thing about this report dashboard is that it uses strictly all the Universal Analytics data stored in the Google Sheets we were just using.
Below, you’ll see an image of the “Data sources” screen of the Google Looker Studio dashboard showing all the Google Sheet report sheets being used to power the dashboard charts:
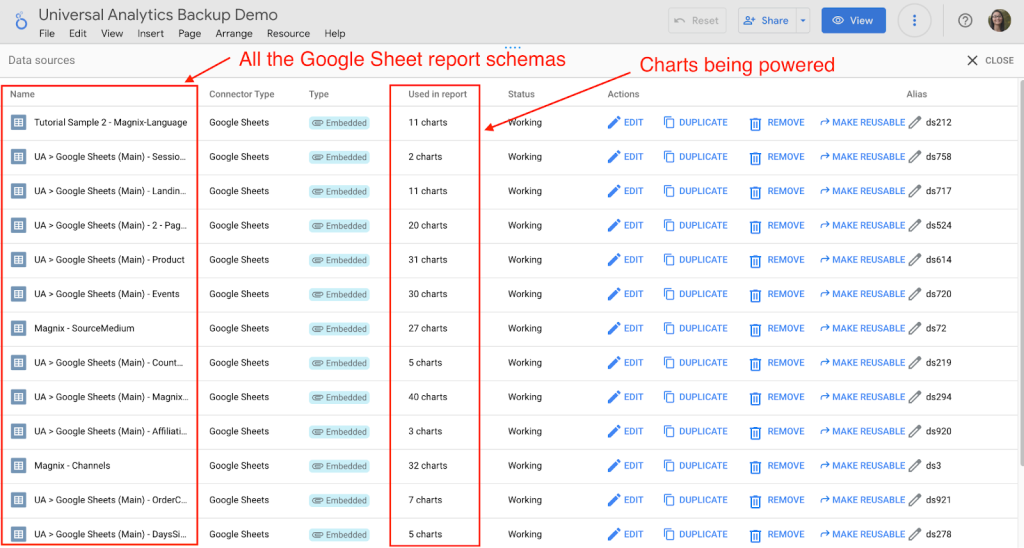
> Save time rebuilding the dashboard and get access to make a copy of it for yourself and/or your business: send an email to grace@vonndata.com to be added to the report for free.
Why Is This the Best Way? (Benefits)
After going through all the other alternative methods for exporting UA data, I found this method to be the best because:
- It gets you all your data in its “raw” format as close as possible without needing to have Google Analytics 360 (GA360 – the enterprise, and expensive, version of the free Google Analytics)
- The data schemas are designed to be flexible enough to power all sorts of different dashboards and reports
- You don’t need programming knowledge (nor do you need to hire an expensive programmer) to code a custom ETL (Extract, Transform, Load) script for you to export the data via the API
- Almost anyone can export due to not needing programming knowledge
- It can power a large number of “replicated” reports that Universal Analytics provides in its UI platform
- It’s FREE – no need to pay for ETL tools like Fivetran, Airbyte, or Funnel.io to export the data (I once quoted a client $2k+ in order to pay for Airbyte’s fees to export the data we managed to export for free)
Drawbacks
After going through the benefits, I think it’s only fair to list out its drawbacks too for transparency.
- May need to batch the process aka split up your date ranges into smaller ranges, in order to avoid sampling the data during export
- May need to split up the data across different spreadsheets (Google Sheets has a cell limit of 10 million cells, so if your data exceeds this, you’d have to split up the data into multiple spreadsheets. We have the “Pages” report and the “Landing Pages” report in their own separate Google Sheet documents since these are the reports that end up exporting the most data.)
- May need to run the reports separately, one at a time, in order to avoid the Google Sheets ScriptError: Maximum execution time error – (This basically means you’re trying to run too many reports at once. Using the “Skip Report” functionality can help you run the reports one at a time, or in chunks at a time.)
Tips for Exporting Universal Analytics Data
- Start now! If you’re missing anything, you’ll find out earlier and will have time to go back, redo schema if you need to, and re-export.
- Batch the process for large amounts of data – If you have large date ranges, we recommend splitting up your date ranges into smaller ranges and running each range separately in order to avoid data sampling.
Other Alternative Export Methods
The first 3 alternative methods listed here are “manual export” methods, meaning you’ll manually export the data directly out of the Universal Analytics platform itself.
Manual export methods are usually more time-consuming since they don’t get all the data you need at once.
The last 2 alternative export methods are more “programmatically” exporting the data for you via the Google Analytics API.
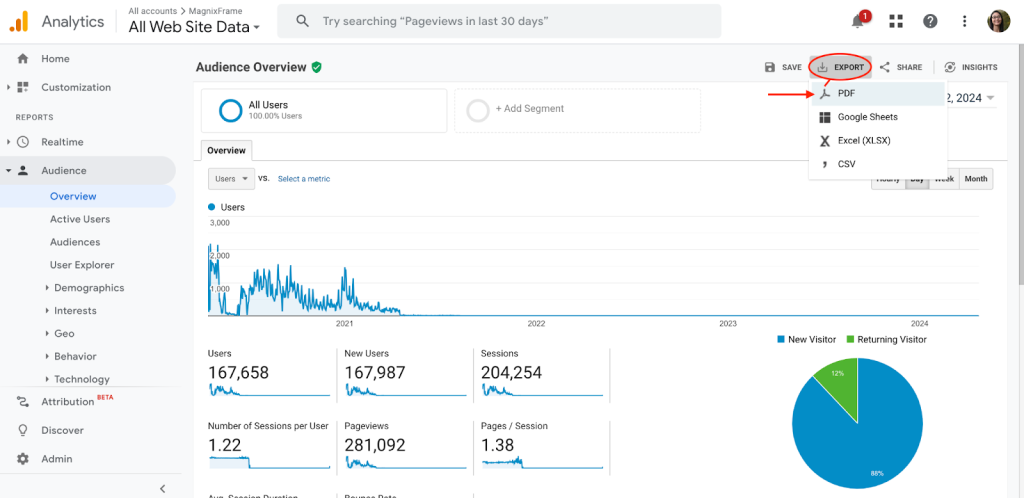
1. Export via PDF from UI Platform
You can export via PDF from the Universal Analytics User Interface (UI):
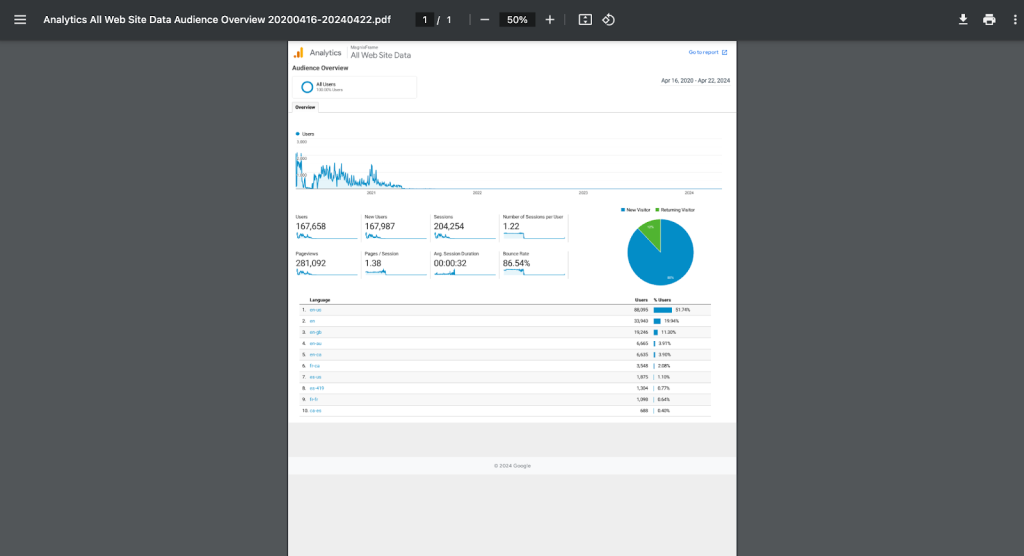
Output:
Pros:
- Quick
- You can export your visuals and charts at the same time
Cons:
- Your data is not flexible (can’t manipulate it in excel or pivot table)
- Difficult to extract data into a table format
How it works:
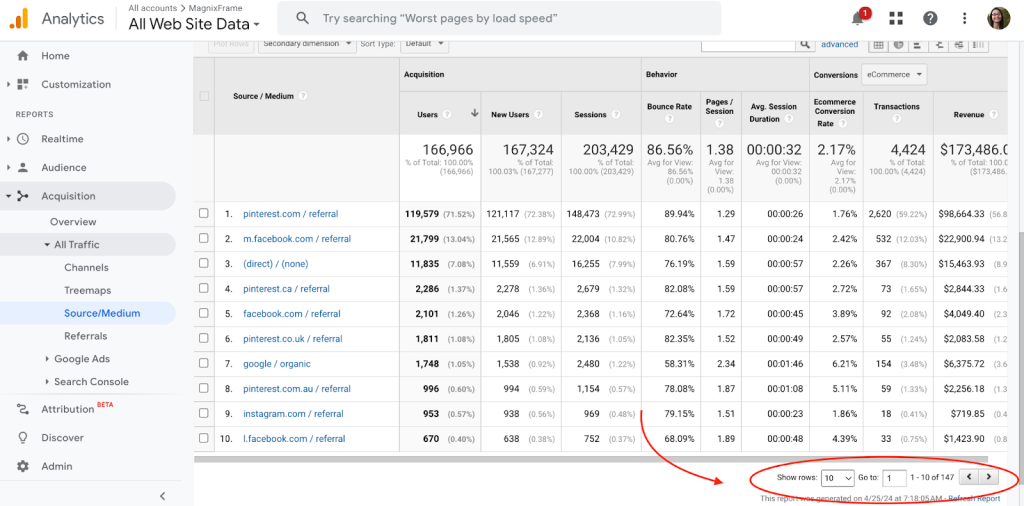
Whatever screen or report you’re on inside the Universal Analytics platform, that’s what will get printed out on the PDF. Literally a screenshot of the entire page (minus the left-hand side menu bar) will end up on the PDF.
The PDF will include: your date range, any segments you have included, the metric name selected on the line chart, the line chart itself, and the detail table below with the dimension selected and metrics.
Take note: the detail table will show at default only 10 rows of data. If you have more rows (you can find out by scrolling all the way to the bottom and look in the bottom right hand corner for the text: “1 – 10 of 147”), just click on the dropdown to select more rows if you need. (The max will be 5000.)

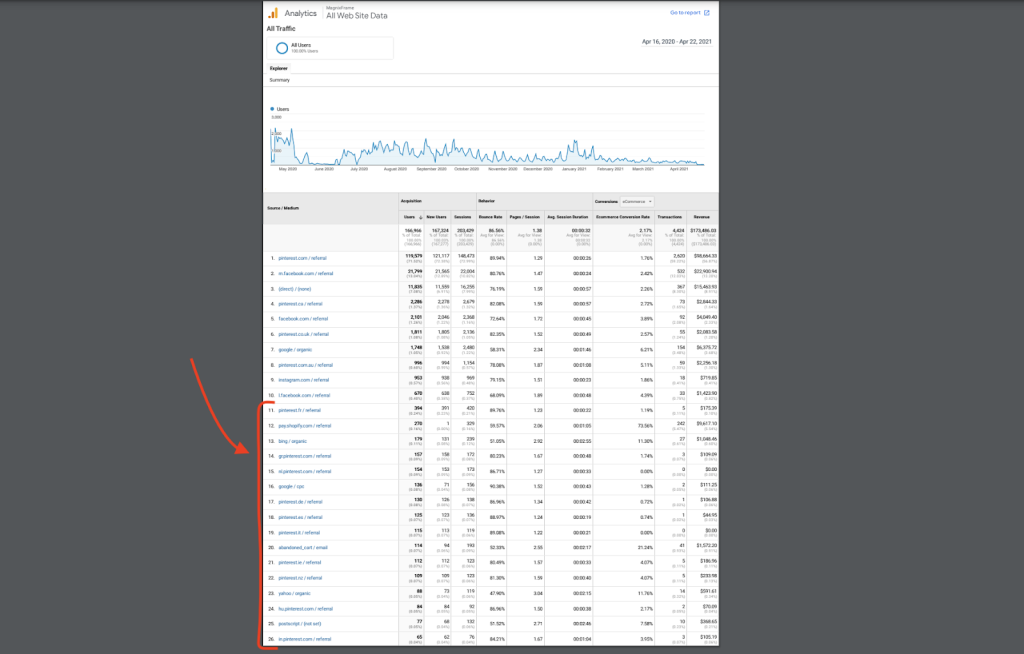
If you re-export via PDF, you’ll then get all the new rows displayed:
Recommendation:
This method would be great if all you needed were the visuals, charts, and if you already knew how you wanted to see your data in the future.
If this PDF is all you needed, then this would be the method for you.
2. Export via Google Sheet from UI Platform
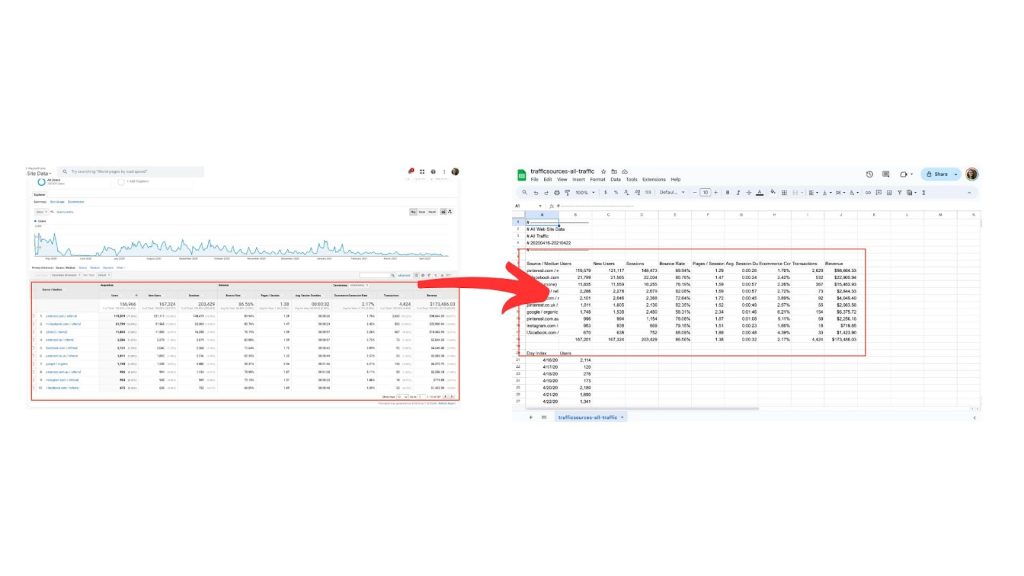
You can export via Google Sheet from the Universal Analytics UI Platform:
Export > Google Sheets
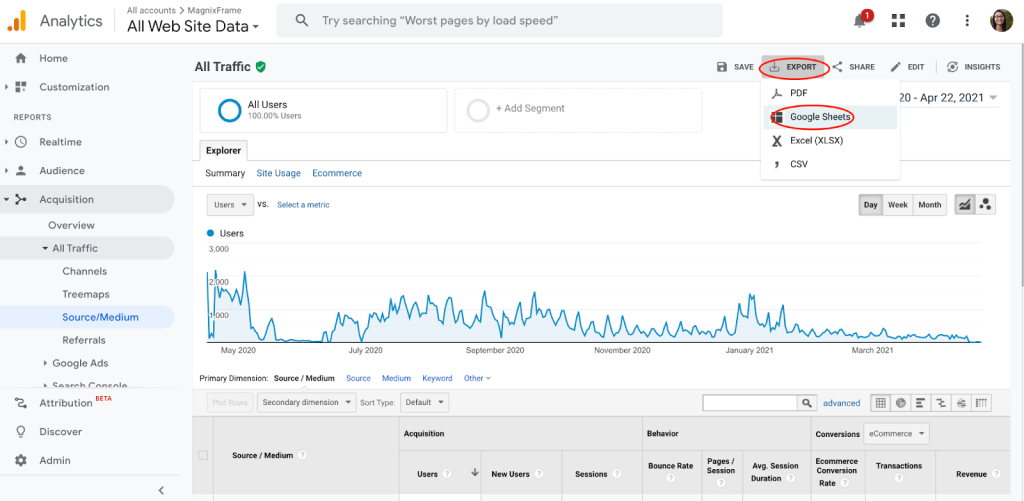
Click on the button “Import the data”.

Output:
Then it will look like this:
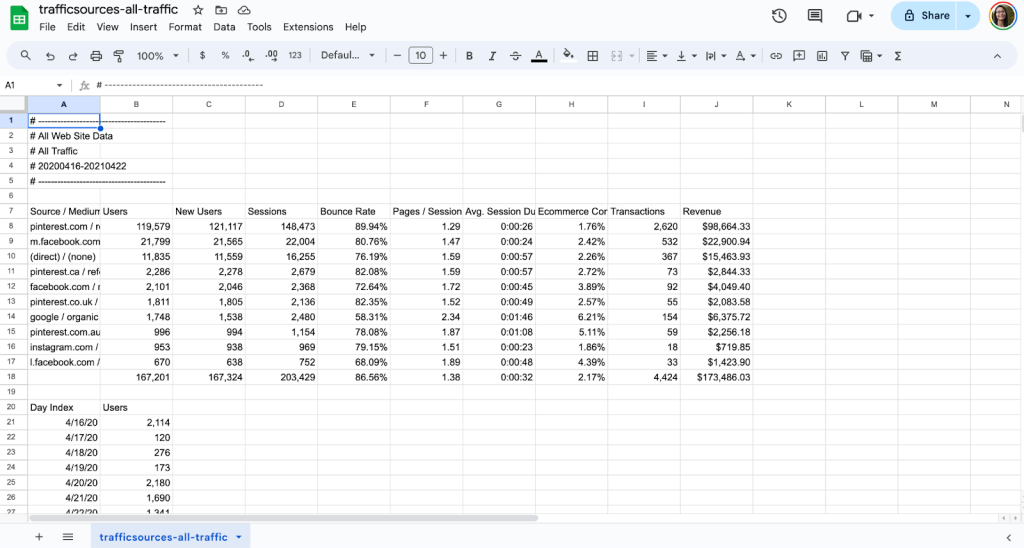
With a totals row at the bottom of the date / metric table:
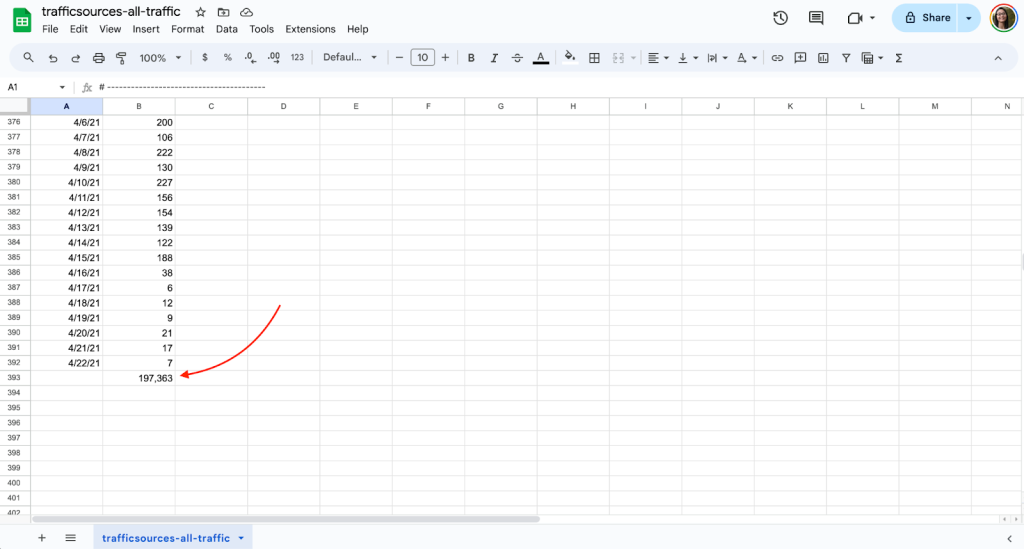
Just an FYI if you wanted to quickly sum up the values in that column, you’d need to delete that totals row first to avoid inaccuracy in your metric.
Pros:
- Quick
- You’ll get data that’s more flexible (a table with your selected dimension and metrics, and a date table)
Cons:
- You still don’t get ALL your data (if you have more than 5000 rows of data, you won’t be able to export them all)
- You’re limited by only 2 dimensions
- You’re limited only by the metrics that are already displayed in the platform
- Still less flexible (if you wanted to know the Bounce Rate of the pinterest.com source for the month of July 2020, you wouldn’t be able to find that out with this data export.)
How it works:
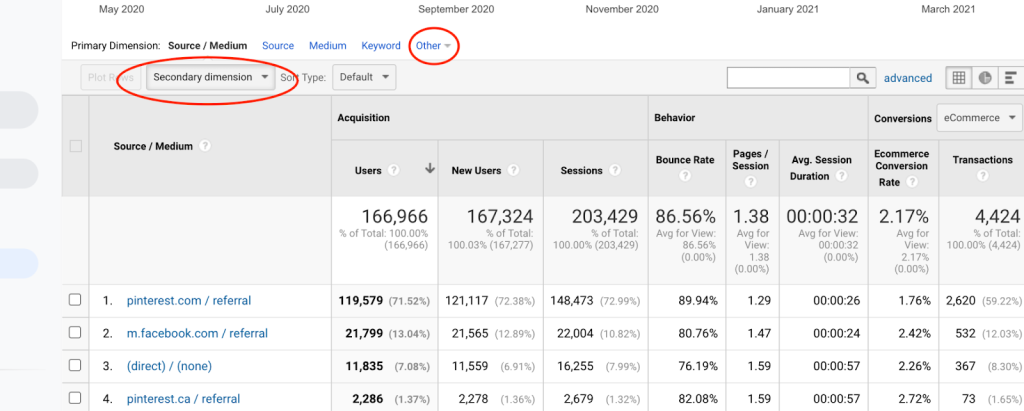
The first table in the Google Sheet (the wider one) will be determined by how you configured your detail table in the Universal Analytics platform (the bottom one):
If you want to add a second dimension (like date, channel, etc.), you can do so by clicking on the dropdown “Secondary dimension”.
And if you want to change the primary dimension, you can click on the “Other” dropdown.
If you want to change the metric displayed by the date table in the Google Sheet, you can do so by clicking on the dropdowns in the UA platform:
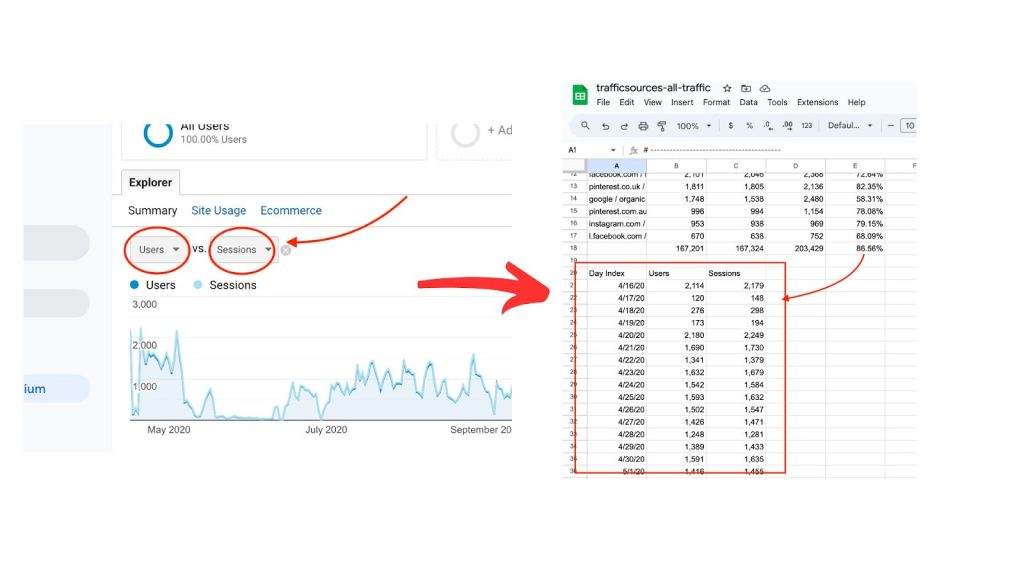
You’ll also notice that there are icons in the UA platform to change the type of detail visualization, like so:
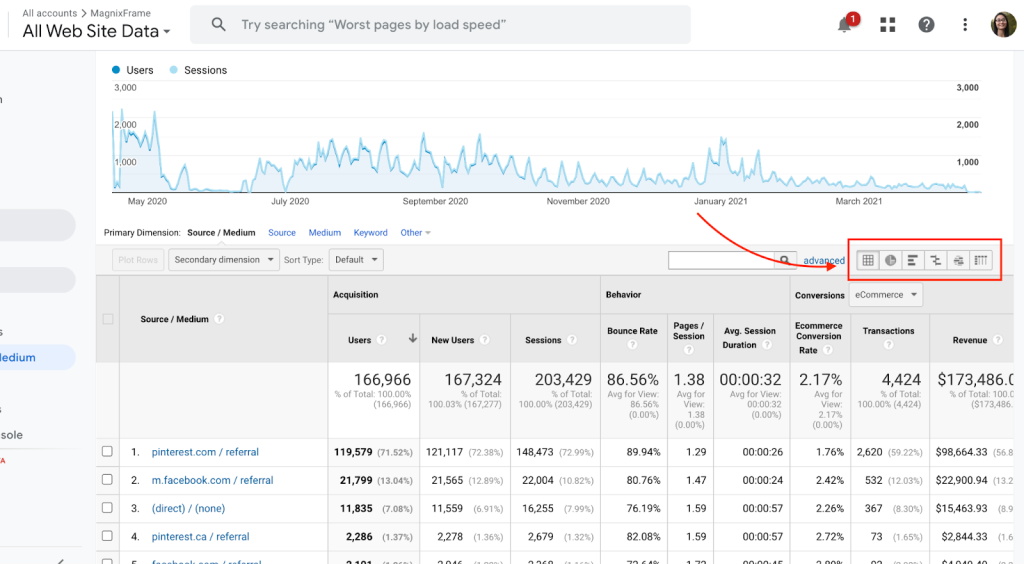
Note: When you change to one of these, and then export via Google Sheet, the exported data will still default to the original detail table (none of these extra visualizations will be exported).
Recommendation:
If this type of data is all you need (max 5000 rows), max 2 dimensions, fixed set of metrics, and only max 2 metrics broken down by date, then this method would be for you.
3. Export via Excel / CSV file from UI Platform
I won’t go over this in detail, because it is almost exactly like the “Export via Google Sheet” option.
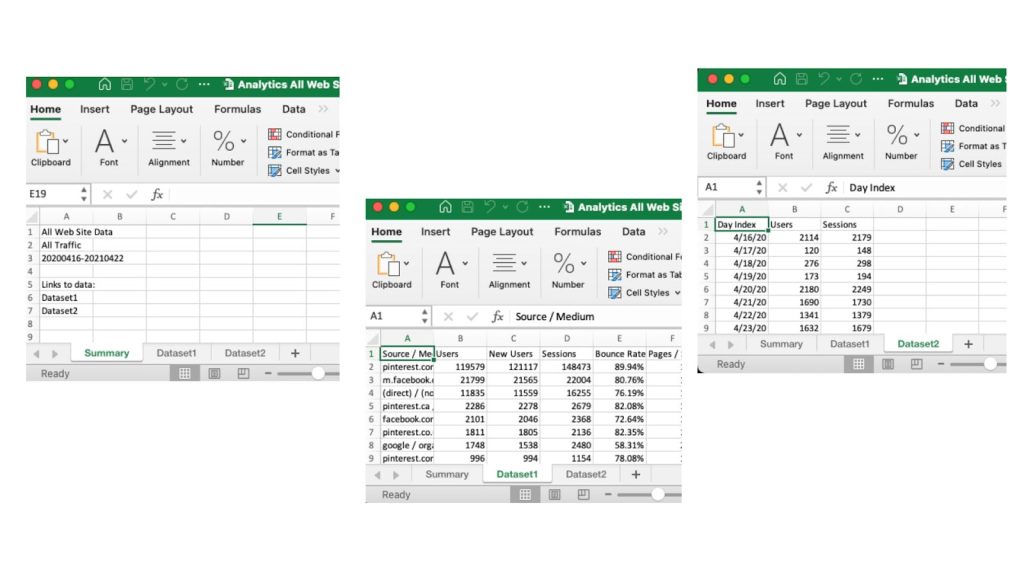
The only difference with exporting via excel is that the data is split up into 3 different tabs:
- Summary – The header information
- Dataset1 – The detail table
- Dataset2 – The date table
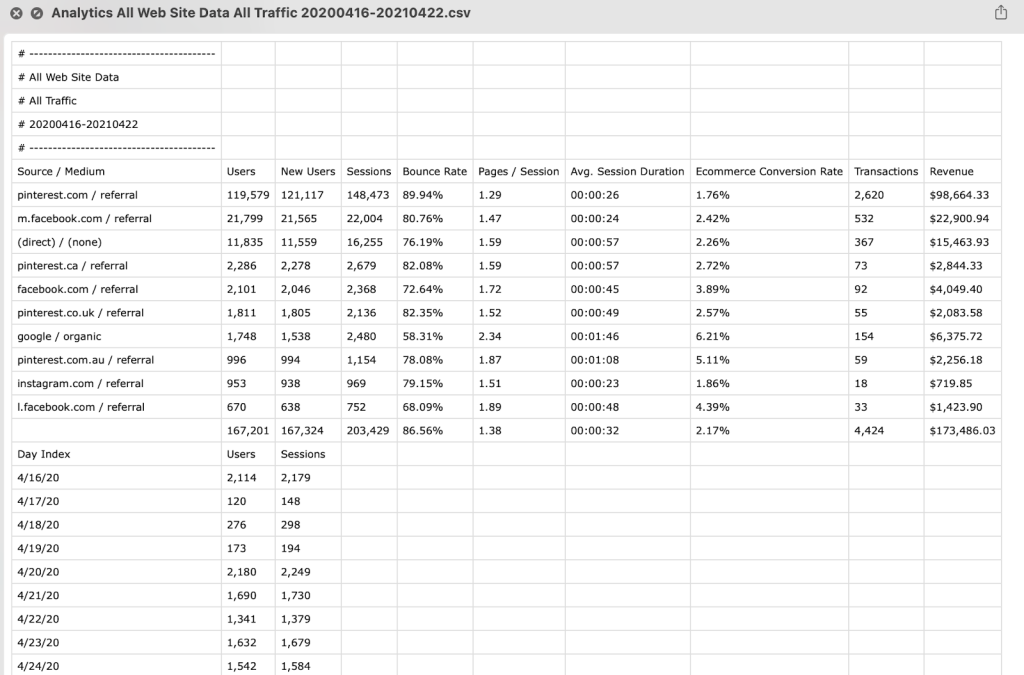
The export via csv file is exactly like the export via Google Sheet – just in a different filetype (csv).
Output via Excel:
Output via csv:
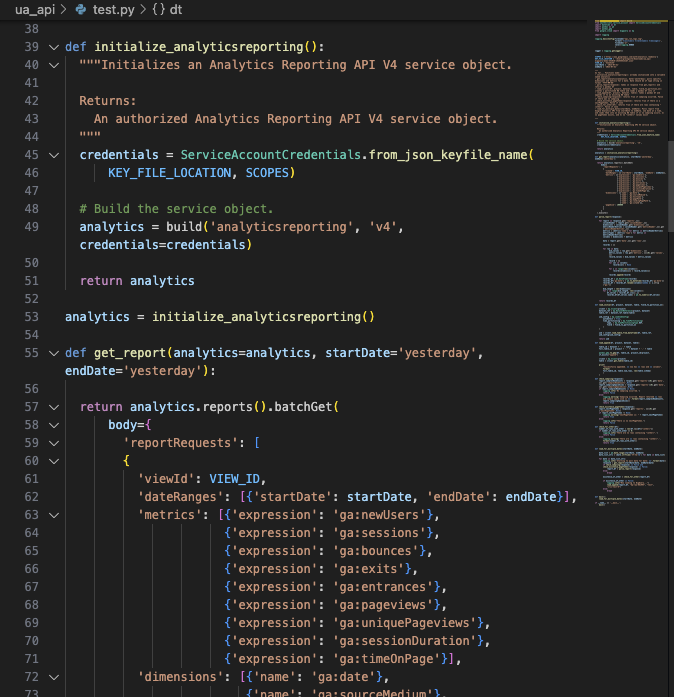
4. Export via Google Analytics API with a custom script
I won’t go over how to do this – because it requires programming / coding work that is waaaayyyy out of scope for this article.
But what this entails is writing a custom ETL (Extract, Transform, Load) script to extract the data from the Google Analytics API and then loading it into a storage place of your choice (usually a database like Google BigQuery or Snowflake).
Pros:
- Extremely flexible – you can basically code whatever you want to pull whatever data you want, but of course within API limits
- Easy (for the programmer) to dump it into a database
- Easy to manipulate and move data once it’s in the database
Cons:
- Expensive – to hire a programmer
- Requires coding knowledge
- Requires you to know exactly what data, dimensions, metrics, and in what combinations you need them in, in order to use this method
Recommendation:
If you have engineering resources and/or have a lot of Universal Analytics properties to export, I would recommend this method.
Just for fun’s sake, I’ll throw in a screenshot of what an example of the code would look like:
5. Export via a Third-Party ETL Tool like Fivetran, Airbyte, or Funnel.io
This method involves using programming skills to pull data from the Google Analytics API – but using a paid software to do that for you.
ETL tools include:
- Fivetran
- Airbyte
- Funnel.io
I won’t go into specifics here either, because each one has their own way of using their own platforms, but the idea is simple: use a little to no-code software tool to pull data from the Google Analytics API and load it into a storage place of your choice.
Pros: (same as exporting via custom script)
- Extremely flexible – you can basically code whatever you want to pull whatever data you want, but of course within API limits
- Easy (for the programmer) to dump it into a database
- Easy to manipulate and move data once it’s in the database
- Don’t need to have programming skills
Cons:
- Would need to learn how to use the ETL platform and/or read from their instruction tutorials
- Costs $$$ – (one client I had data requirements that was quoted to cost $2k+ for extracting via Airbyte)
Recommendation
If you already have one of these tools, I highly recommend already leveraging it to export your Universal Analytics data.
Otherwise, if you have more custom data requirements either from a client or yourself, and you don’t have engineering resources to build your own custom script, I recommend trying out one of these ETL tools.
Overall Recommendation:
If you:
- Don’t know exactly what your data requirements are (what dimensions and metrics to export)
- Don’t have engineering resources to write a custom ETL script to extract data from the Google Analytics API
- Are on a tight budget
- Looking for a way to just easily export your data with little headaches
Then, I recommend:
Using the free Google Sheets Add-on Tool with the free templates I linked to above.
Storing Universal Analytics Data
Aside from exporting the data, it’d also be helpful to consider how you’re going to store it.
Here are the ways to store your data:
- via csv / Excel
- via Google Sheets
- via a Database (ie. BigQuery)
1. Store UA Data via CSV File / Excel
This would be an easy and convenient way – usually the most top of mind method of storing data.
It involves taking your data and storing it usually on your local file system or in a cloud drive like Google Drive, OneDrive, Dropbox, etc.
One way to store UA data via csv / Excel would be to name all your files the same way while changing just the date range, for example:
- ua-export-channels-2021_01_01-to-2021_12_31
- ua-export-channels-2022_01_01-to-2022_12_31
- ua-export-channels-2023_01_01-to-2023_12_31
This way, it’d be easy to see what the contents of the file are just by looking at the file name.
Pros:
- Easy to save
- Easy to transport / migrate if you have only a few files
Cons:
- If your data is split up into multiple files, it may be difficult trying to access them if you want to view metrics for all date ranges at once.
2. Store UA Data via Google Sheets
This is very similar to storing data via csv and Excel. In our recommended way of exporting Universal Analytics, we had our data stored directly inside of Google Sheets, just because when we exported using the Google Sheets Add-on Tool for Google Analytics, the data just landed inside of that same Google Sheet.
There were little to no benefits to changing up the filetype / file to a csv or excel since we were able to access and even visualize the data in Looker Studio straight out of Google Sheets.
Pros:
- Easy to save / store
- Able to download via csv or excel if needed
Cons:
- Limited to 10 million cells
3. Store UA Data via a Database (ie. BigQuery)
Another option for storing UA data would be via a cloud database, like BigQuery or Snowflake.
In my experience, storing and processing costs for using a cloud database like BigQuery are very minimal. (View here for more details on BigQuery costs.)
Getting data into the database would be your biggest challenge (if you have a developer or data engineer help, you could have them do this task). But once the data is in there, it becomes easy to access and manipulate (using a language called SQL – Structured Query Language).
This option would be best if you have A TON of data.
Pros:
- Costs are minimal
- Scalable to millions and billions of rows of data
- Data is accessible and flexible
Cons:
- May need a developer’s help to loading the database with your data
A Note on Transferring / Migrating Universal Analytics Data to Google Analytics 4 (GA4)
There is currently no way (and no quick “push” button) to quickly and easily transfer your UA data into your Google Analytics 4 property.
In fact, this option is not even possible, since Universal Analytics data is collected and processed differently from GA4 data.
UA and GA4 are two completely different ways of collecting data, so migrating data from one platform to the other will not be possible.
HOWEVER…
There is a way to still “stitch” together your Universal Analytics data with your GA4 data. It will just require some work. Here is a quick example of how you would do that.
How to Stitch Together Universal Analytics Data with Google Analytics 4 Data
Easiest way to stitch together, or combine, your data sources is by:
- Ensuring both sources have the same “schema” (aka. name of columns and column order)
- Using a time period field like “date” as the field for “stitching”
Here is an example:
If your Universal Analytics data looked like this:
| Month of Date | Sessions | Data Source |
| 2023-01-01 | 6516 | Universal Analytics (UA) |
| 2023-02-01 | 6920 | Universal Analytics (UA) |
| 2023-03-01 | 6548 | Universal Analytics (UA) |
| 2023-04-01 | 5456 | Universal Analytics (UA) |
| 2023-05-01 | 7452 | Universal Analytics (UA) |
| 2023-06-01 | 8216 | Universal Analytics (UA) |
And your GA4 data looked like this:
| Month of Date | Sessions | Data Source |
| 2023-07-01 | 7512 | Google Analytics 4 (GA4) |
| 2023-08-01 | 8456 | Google Analytics 4 (GA4) |
| 2023-09-01 | 8102 | Google Analytics 4 (GA4) |
| 2023-10-01 | 8624 | Google Analytics 4 (GA4) |
| 2023-11-01 | 9012 | Google Analytics 4 (GA4) |
| 2023-12-01 | 9177 | Google Analytics 4 (GA4) |
Your “stitched” data would look like this:
| Month of Date | Sessions | Data Source |
| 2023-01-01 | 6516 | Universal Analytics (UA) |
| 2023-02-01 | 6920 | Universal Analytics (UA) |
| 2023-03-01 | 6548 | Universal Analytics (UA) |
| 2023-04-01 | 5456 | Universal Analytics (UA) |
| 2023-05-01 | 7452 | Universal Analytics (UA) |
| 2023-06-01 | 8216 | Universal Analytics (UA) |
| 2023-07-01 | 7512 | Google Analytics 4 (GA4) |
| 2023-08-01 | 8456 | Google Analytics 4 (GA4) |
| 2023-09-01 | 8102 | Google Analytics 4 (GA4) |
| 2023-10-01 | 8624 | Google Analytics 4 (GA4) |
| 2023-11-01 | 9012 | Google Analytics 4 (GA4) |
| 2023-12-01 | 9177 | Google Analytics 4 (GA4) |
If you wanted a SQL code for it (because let’s just say you managed to get your Universal Analytics data into a BigQuery database, and you got your GA4 property piping data into there too…), it would look like this:
with ua_data as (

  select

    date,

    sessions,

    “Universal Analytics (UA) as data_source

  from `your-project-id.your-dataset-id.universal_analytics`

  where date < ‘2023-07-01’

),

ga4_data as (

  select

    date,

    sessions,

    “Google Analytics 4 (GA4)” as data_source

  from `your-project-id.your-dataset-id.ga4-table`

  where date >= ‘2023-07-01

),

stitched_together as (

  select * from ua_data

  union all

  select * from ga4_data

)

select * from stitched_together
And there you have it! Hopefully, this article helps you export your Universal Analytics in time, or at least gives you some direction in how to go about it.
If you need an expert to help you, feel free to contact me at grace@vonndata.com.